Guest posting by Emile Gleeson
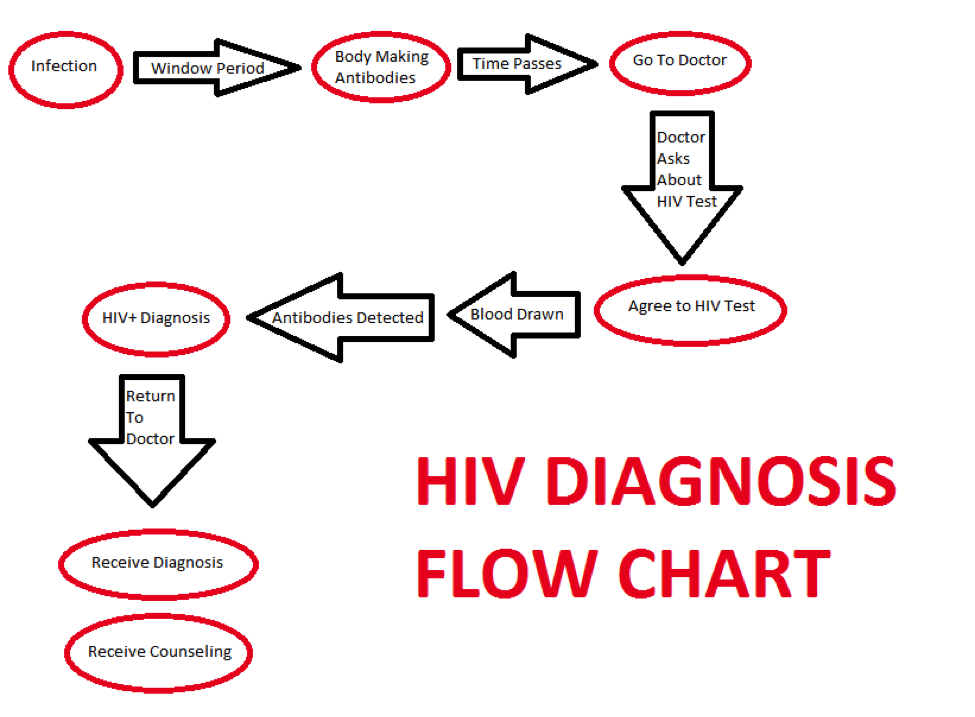
As I searched the web for ideas for my next blog post I tried finding some sort of visual representation of the HIV diagnosis process to comment on. However, much to my dismay, the only visuals I could find were either much too simple (such as a single image of an HIV+ person) or much too complicated (with lots of medical/scientific terminology that the average person wouldn’t be able to understand). Thus, I decided to make my own flow chart of the HIV diagnosis process. I attempted to create a visual that both shows all the steps in the HIV infection/diagnosis process and is simple enough for the average person to understand. This flow chart is shown below.
Sources:
http://hivinsite.ucsf.edu/insite?page=basics-00-18
https://www.aids.gov/hiv-aids-basics/prevention/hiv-testing/get-the-basics/

